
Hundreds of gigabytes per mission. Limited staff. No environmental context.
Weeks of post-survey image review for every single mission.
Counts alone don't explain why species move. Climate? Habitat stress?
Staff shortages limit survey frequency. Coverage shrinks. Blind spots grow.
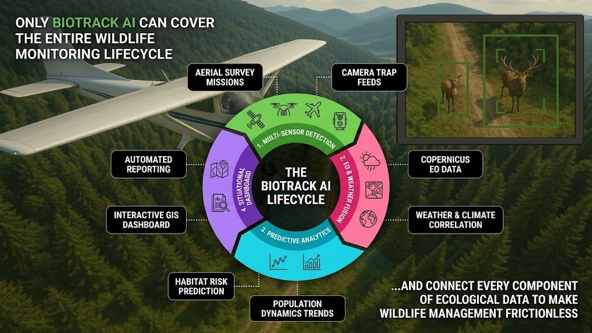
BioTrack AI connects every component of ecological data — from aerial surveys and camera traps to Copernicus EO data, weather correlation, and predictive analytics — so wildlife management becomes frictionless.
Automated species counts, animal density heatmaps, weather correlation, and AI-generated insights — all in one dashboard.
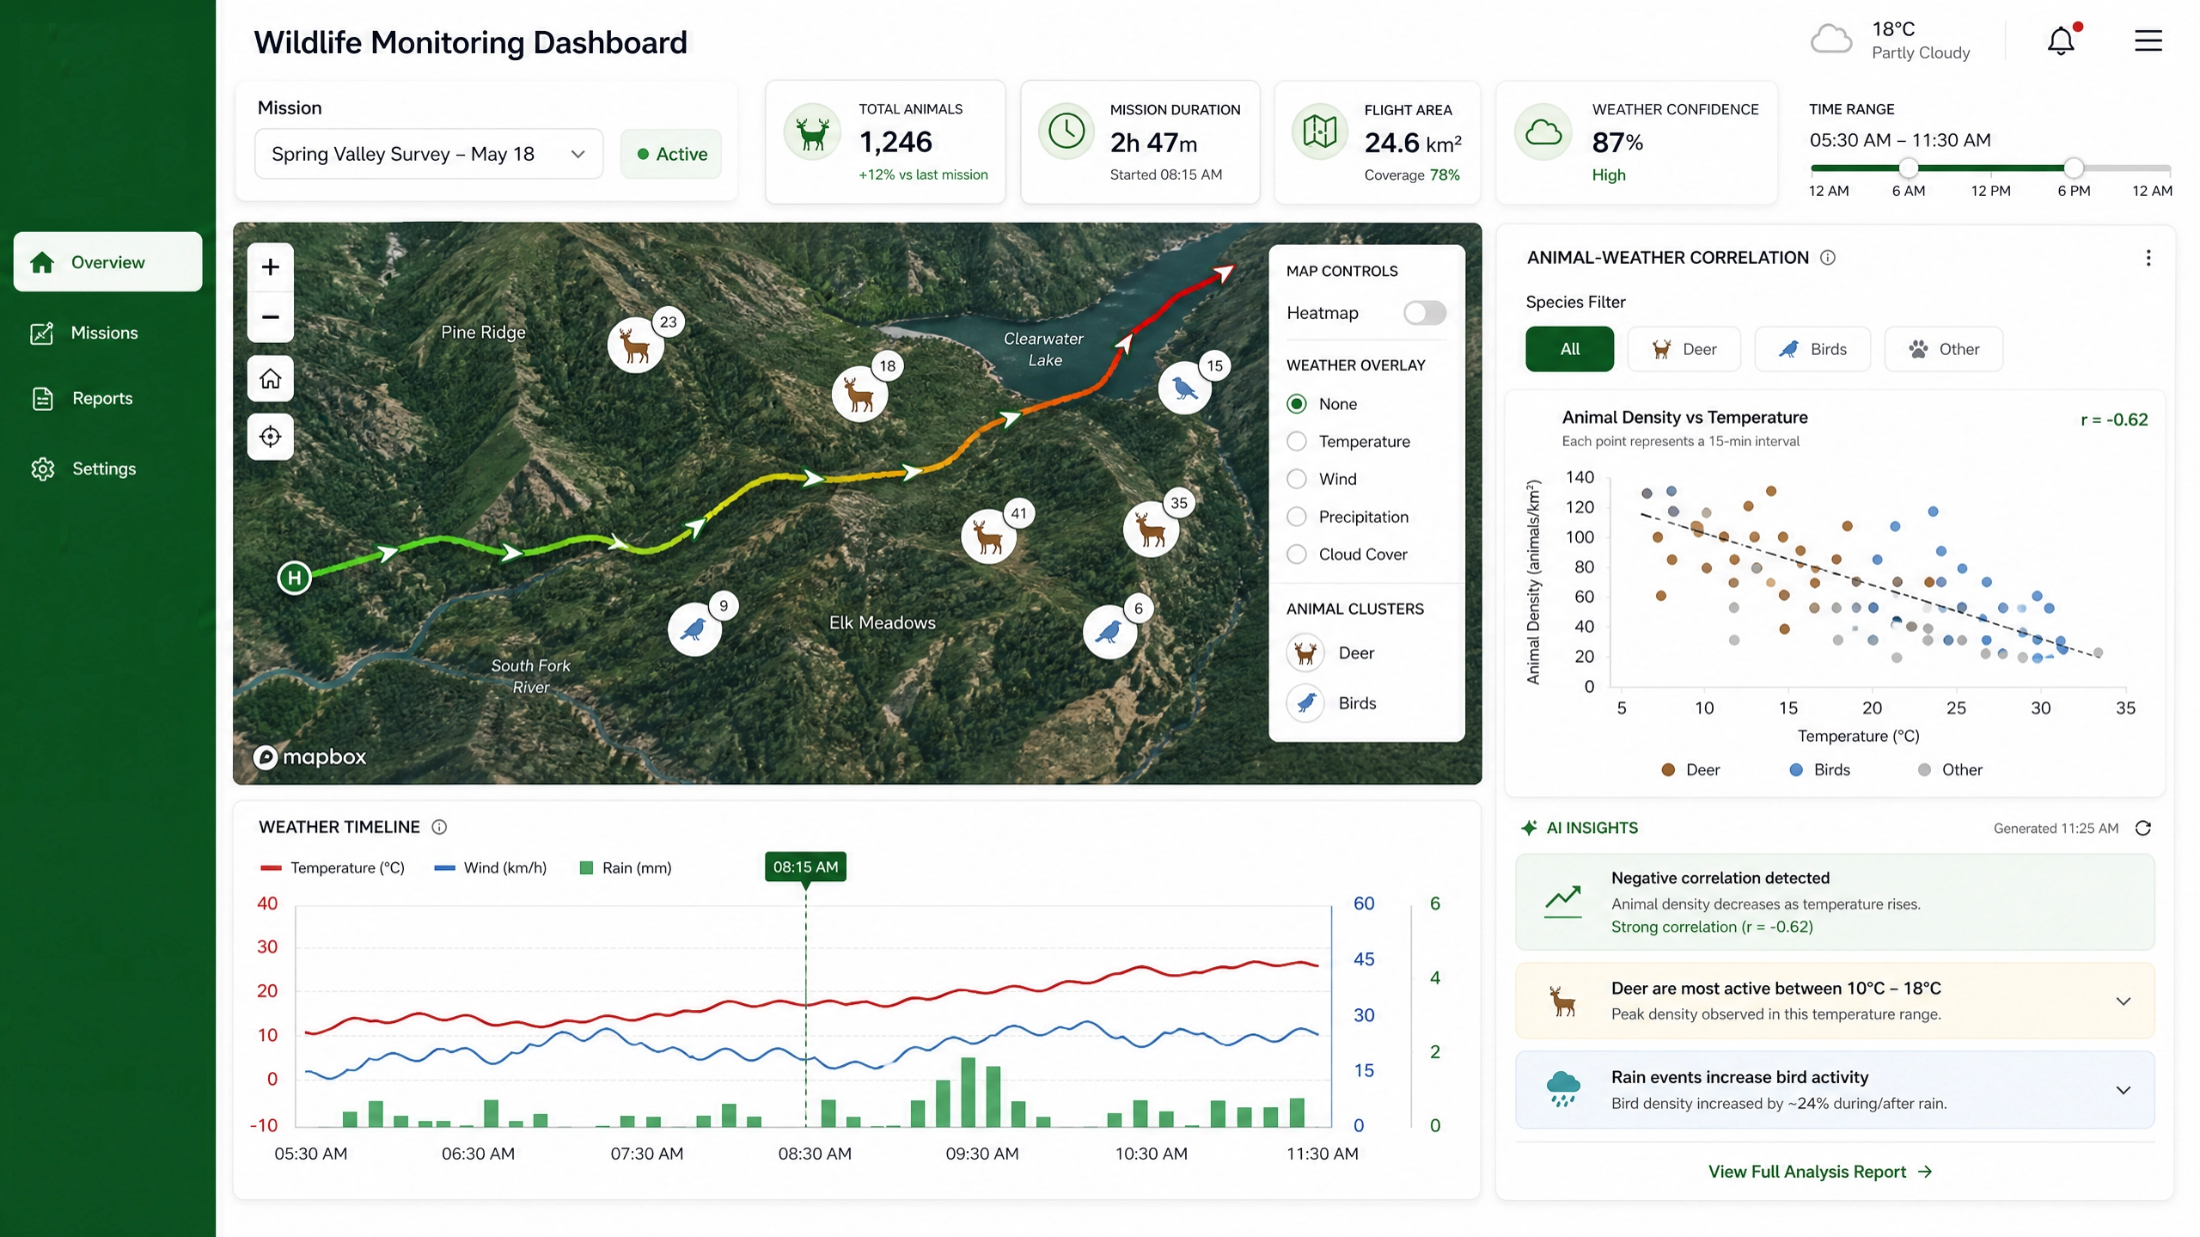
Automated counts and density heatmaps across survey areas.
Real-time correlation between animal activity and temperature, wind, rain.
Automated findings like negative correlation detection and activity windows.
Two stages: AI model development, then AI-powered monitoring in operation.
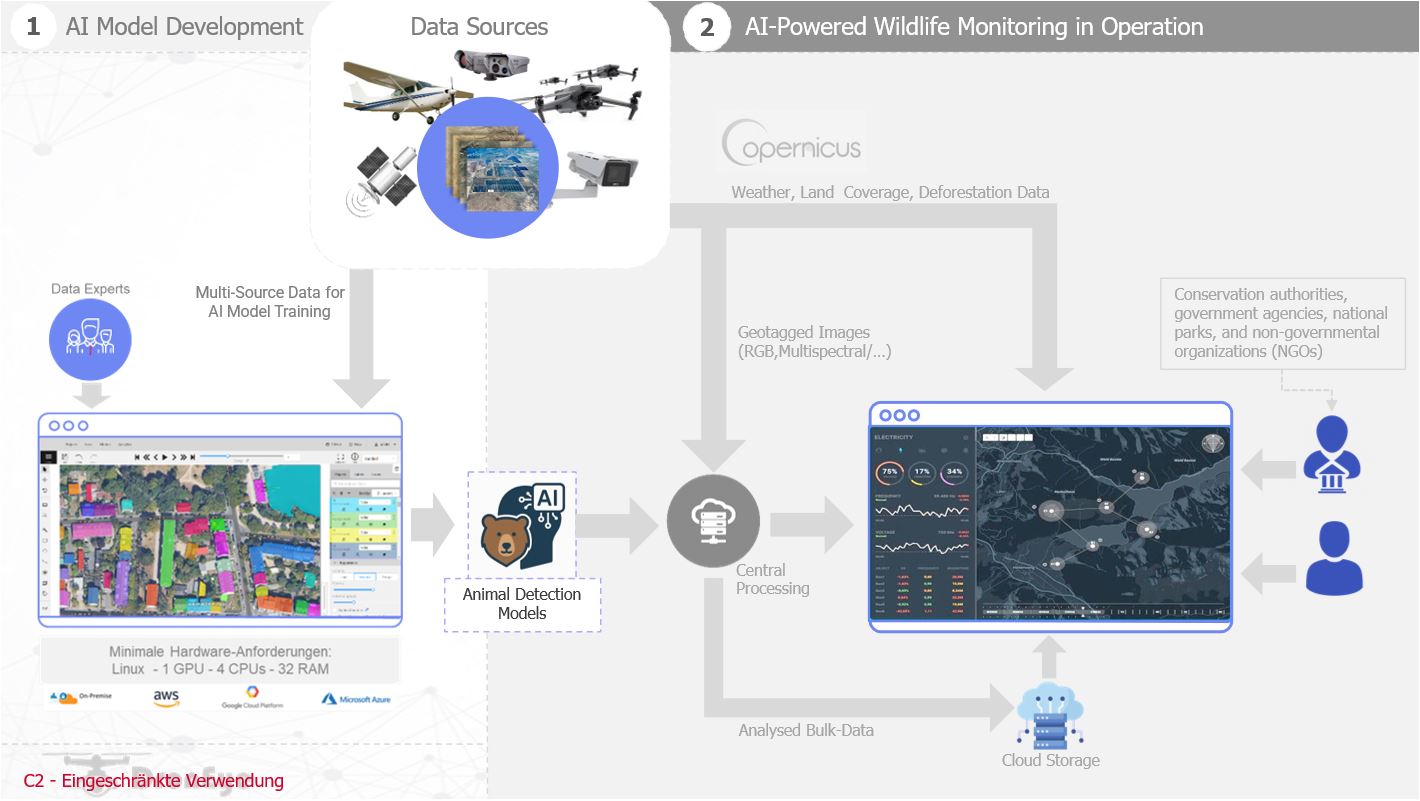
Aerial detection without EO context is just dots on a map. Copernicus and Galileo turn those dots into ecological intelligence.
Sentinel-2 NDVI reveals vegetation stress. Land cover changes expose habitat degradation. Deforestation is tracked in near-real-time.
Sub-meter geotagging. Exact spatial mapping. Repeatable transects across missions. Long-term trend analysis becomes possible.
Feasibility study in progress. PoC replay pilots on the horizon.
Formal user requirements defined with LOI partners.
RGB and thermal imagery annotated for baseline AI models.
OVHcloud pipelines support AI training and Copernicus API ingestion.
Weather data overlays being integrated. PoC replay pilots next.
Prime Contractor: DronEye UG, Germany
Supported by ESA Business Applications